





Magento Tutorial
How Tideways Helped Us Uncover the Hidden Bottlenecks in a Slow Magento PLP
Mahaveer Devabalan|Dec 26, 2025|Read 3 Min


KnockoutJS is a popular JavaScript library that is widely used in Magento 2 to handle dynamic UI elements. It provides a convenient way to bind data and update the UI automatically whenever the data changes. However, when working with complex KnockoutJS components, it is not uncommon to encounter bugs or issues that need to be debugged. In this blog post, we will explore how to debug KnockoutJS components in the console using RequireJS in Magento 2.
Before we dive into debugging KnockoutJS components, make sure you have the following prerequisites in place:
● A working installation of Magento 2.
● A basic understanding of KnockoutJS and RequireJS.
● A basic understanding of browser developer tools.
Debugging Knockout.js in Magento 2 can indeed be challenging due to the complexity of the Magento platform and the way Knockout.js is integrated into it. Here are some of the challenges you may encounter when debugging Knockout.js in Magento 2:
Magento 2 has a complex and layered architecture. It uses a combination of PHP, JavaScript, RequireJS, and XML configurations, which can make it challenging to trace the flow of data and identify issues.
Magento 2 heavily relies on Knockout.js for its frontend components, such as checkout, product pages, and customer account sections. Debugging Knockout.js code can be more challenging than traditional JavaScript because of its declarative nature.
Magento 2 has a large codebase with numerous JavaScript files and templates. Finding the specific JavaScript code responsible for a particular functionality or issue can be time-consuming.
Magento 2 uses a UI Component system to manage Knockout.js components. These components are defined in XML files, and it can be challenging to track how data flows between the UI components and the backend PHP code.
Magento 2 allows for extensive customization through themes and extensions. Third-party extensions can introduce their own Knockout.js code, which can interact with core Magento functionality and lead to compatibility issues.
Knockout.js components in Magento 2 often load asynchronously, which means that the order in which they execute may not be immediately obvious. This can make it harder to debug issues related to component initialization and data binding.
Before we start debugging, it is recommended to enable the developer mode in Magento 2. This can be done by running the following command in the Magento root directory:
bin/magento deploy:mode:set developer
Enabling the developer mode will display detailed error messages and enable debugging tools
Once the developer mode is enabled, the next step is to locate the KnockoutJS component that needs to be debugged. In Magento 2, the KnockoutJS components are defined in JavaScript files located in the view/frontend/web/js directory of the module.
Use the RequireJS module name of the component to locate the corresponding JavaScript file. For example, if the component is defined in a file named my-component.js and the module name is Vendor_Module/js/my-component, then the JavaScript file can be found at Vendor/Module/view/frontend/web/js/my-component.js.
Let’s use the checkout page as an example,
Syntax:
require(['component'], function (value) {
window.value = value;
});
Example:
// Load the "quote" component using RequireJS
require(['Magento_Checkout/js/model/quote'], function(quote) {
// Now you have access to the "quote" component
window.quote = quote;
});
The above code in your web browser’s console will load the Magento_Checkout/js/model/quote module, making it accessible for further use or debugging within the browser environment.
I’ve assigned the quote data to `window.quote` here, but feel free to adapt your JavaScript code according to your specific needs.
Now, you can utilize `quote` to display the quote components.
quote;
Sample output:
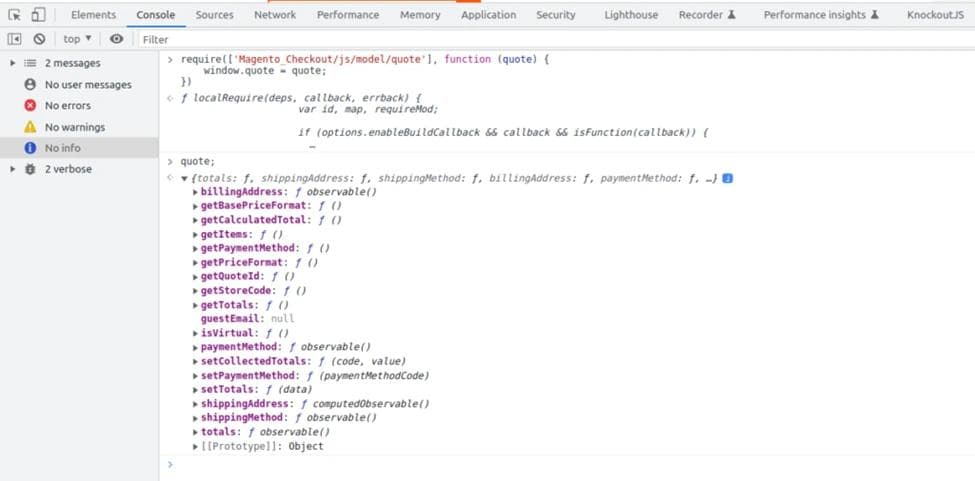
In the sample output provided above, you can observe all the items of the quote model.
Let’s compile a list of all the items available in the quote model.
To display all quote items, you can use the following:
quote.getItems();
Sample output:
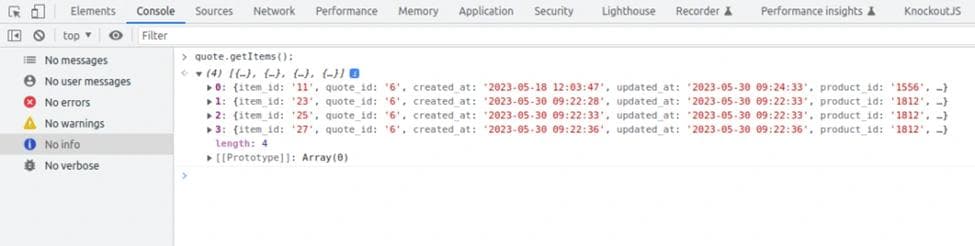
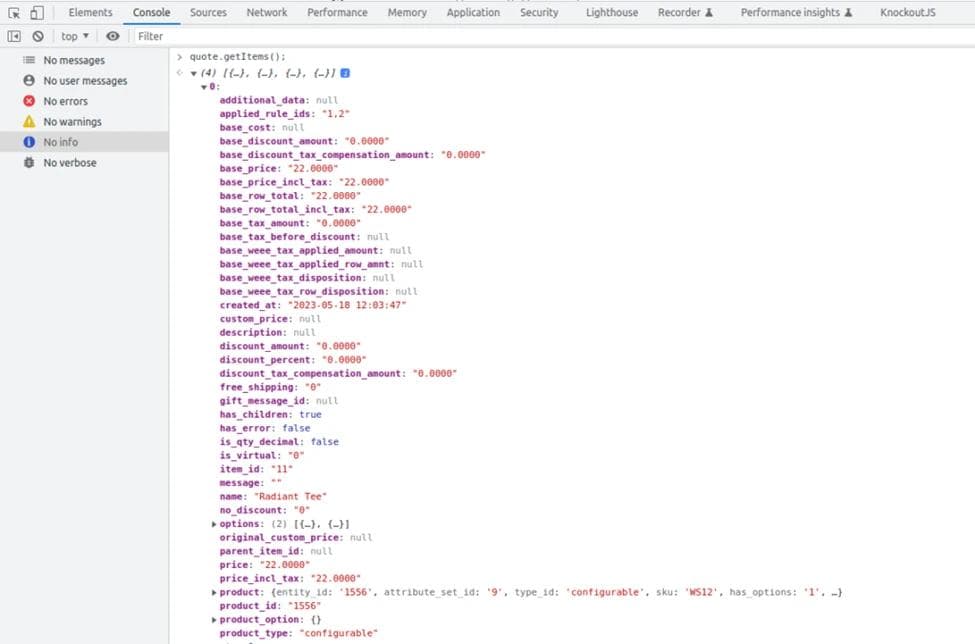
In the snapshot above, you can get all the necessary data about your quote items.
For better clarity, let’s attempt to print the product name of the first quote item:
quote.getItems()[0].name;
Similarly, you can retrieve any of the values available in the model using the same approach.
When something goes wrong with your KnockoutJS code, the browser’s console is the first place to look for error messages and warnings. It provides a detailed stack trace that helps you pinpoint the exact location of the issue. By examining the error message, you can quickly identify the cause of the problem and take appropriate action.
Data bindings are at the core of KnockoutJS. They allow you to establish a connection between your UI elements and the underlying data model. In the browser’s console, you can inspect the current state of your data bindings and make changes on the fly. This is particularly useful when you want to test different scenarios or troubleshoot issues related to data binding.
One of the biggest advantages of using the browser’s console for debugging KnockoutJS components is the ability to make live changes to your code. You can modify your code in real time and immediately see the results in the browser. This makes the debugging process much faster and more efficient, as you don’t need to constantly refresh the page to test your changes.
The browser’s console provides a wealth of information about the performance of your KnockoutJS code. You can use the console to measure the execution time of your functions, track memory usage, and identify any potential bottlenecks. By analyzing this data, you can optimize your code and improve the overall performance of your application.
The console is not just for displaying error messages. It can also be used to log important information and debug statements. By adding console.log statements to your code, you can track the flow of execution and monitor the values of variables at different points in your application. This can be particularly useful when you’re trying to understand how your KnockoutJS components interact with each other.
Debugging KnockoutJS components in the console using RequireJS in Magento 2 is a straightforward process that can help developers identify and fix issues quickly. By following the steps outlined in this blog post, you can effectively debug your KnockoutJS components and ensure a smooth user experience on your Magento 2 website.
This usually means RequireJS hasn't finished loading on the page yet, or you're on a page that doesn't use it. Make sure the page has fully loaded before running your require() call in the console.
The most common cause is a typo in the module path, or trying to log the variable before RequireJS finishes resolving the dependency asynchronously. Add a console.log inside the callback itself to confirm the module actually loaded.
Check the component's .js file path under view/frontend/web/js/, then match it against the requirejs-config.js or the module's namespace convention (Vendor_Module/js/filename). Browser dev tools' Network tab can also show you the resolved module paths as they load.
This is usually a data-binding timing issue. Since Magento 2 components often load and re-render asynchronously, a component may be referencing stale data or firing before the updated quote/cart data is available.
Some developers use browser extensions like Magento 2 DevTools (a Chrome extension) or modules like ui-debug to inspect UI components and RequireJS module registries visually, instead of typing console commands repeatedly.

Get tailored technology solutions to scale your retail business online
Request A Quote

Stay ahead with insights, trends, and brand success stories from the world of Digital Commerce.


DTECH, Techno Hub 1, Dubai Silicon Oasis Authority, United Arab Emirates - Dubai - United Arab Emirates

Level 1, Building 7, Zone A Airport road, Business Gate P.O Box 93597 Riyadh 11683, KSA.


Codilar Digital Pte Ltd, 68 Circular Road, #02-01, 049422, Singapore

7th Floor, Jupiter Block Prestige Tech Park, Kadubeesanahalli, Bellandur Amtankere, Bengaluru, Karnataka 560103

Satrio Tower, Floor 6, Unit C and D, Desa/Kelurahan Kuningan Timur, Kec. Setiabudi, Kota Adm. Jakarta Selatan, Provinsi DKI Jakarta